Percepción remota Parte 3: Procesamiento de imágenes
3. Resources on Image Processing.
 After having passed through the readings that explain what Remote Sensing refers to, the next concern for practical (engineering)-quantitative applications is to "use" the data contained in the imagery, i.e., to process and analyze the imagery.
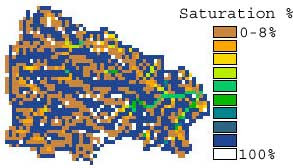
Then, after processing (e.g., using basic GIS tools), the final output may look like the product shown in the image on the left. How to do it?
3.1 Pre-processing
Most imagery available for use in practical applications can and should not be used without pre-processing. This involve:
- To turn the data "readable": It will be necessary to transform the compressed data contained in the imagery, from the format at which the platform acquires the scenes (commonly compressed formats), into a format that is readable by the tool we wish to use for the interpretation of the data (binary, GIF, JPG, etc). For practical applications, it is common that whenever the imagery is provided in a very specific format difficult to be read by common languages (C, Fortran), or in a format that is unreadable using software (e.g., Photoshop, Matlab, Erdas), this pre/processing step is covered by the data providers themselves, or by major institutions such as the USGS for the case on NASA acquired information. Those institutions provide free online and portable tools to convert their data into common readable formats.
1. MODIS imagery. Is distributed in HDF format. NASA provides several WEB based and portable tools to visually analyze the data. My advise is to try each until finding the one that suits your needs. Try to start by using the alternative that can help you to transform the geographical coordinates, that allows trimming the scene (in order to save disk space), and that allows exporting the data into a readable format.
2.- LANDSAT imagery. Data from the USGS' EROS and GLOVIS are available in a format readable by most commercial software (e.g., ERDAS).
- To "calibrate" the data: Which begins with the georeferentiation (to assign a geographical location, or geographical system), and continues with the "correction" of the original data. The latter is the transformation and correction of anomalies caused by the instrument on board of the satellite, the acquisition method used by the satellite platform, and the correction of the anomalies in the data caused by the mean through which the data has traveled (the atmosphere, the geographic obstacles), from the source (the satellite) to the target (the land feature being observed).- Calibration of Landsat and ALI imagery: A concise and clear summary is presented in Chander et al., 2009. You may want to check this paper just after having gone through any image processing tutorial. Highly recommended.
- Julian date calendar: For imagery calibration.
- Quantitative remote sensing of land surfaces. Again, this book summarizes most techniques used to process satellite imagery. However, it major flaw are the errors that may be found in some equations. Please check the link provided for details.
3.2 Atmospheric, topographic and other corrections:
Although it is a part of the pre-processing stage, the amount of atmospheric and topographic corrections proposed is so large that I prefer to summarize them in a separated subheading.
a) Atmospheric corrections.
Aerosols, clouds and their shadows are the principal "contaminants" of optical imagery received at a sensor's platform (Liang, 2004). Basically, the corrections of those interferences are implicitly considered within the calibration process; However, when reviewed in depth, the atmospheric corrections can involve several considerations. Some links online, besides the ones provided above, that provide additional guide on the procedure are:
- Atmospheric correction tool, an ArcView GIS based tool by Prof. Douglas Ramsey (1999). Even though I have not used it, this tool provides a guidance on the steps that should be followed before using, e.g., Landsat imagery. This guidance is worth visiting because it should be an inspiration to construct your own tool. Thus, the software (and the cost involved) turns to be a secondary matter.
b) Topographic corrections.
Authors such as Riano et al (2003) have reviewed several topographic corrections, and have concluded that for general purposes, given the uncertainty introduced by disparity between the coarse spatio-temporal resolution of imagery provided by some optical sensors and the spatio-temporal resolution of ground calibration data, simple band arithmetics may implicitly and substantially correct the effects of topography on the data contained in the scenes, for practical purposes. Nevertheless, the interest in assessing the effects of reducing the effects of topography is still alive:
- Explanation of the effects of topography on sensor's radiance, a series of slides prepared by the Biodiversity Informatics Facility, American Museum of Natural Sciences. It shows some effects of the change in the solar elevation, in the solar azimuth, and shadow correction. Again, a discussion on the uncertainty in those corrections is reviewed in Rianno et al. (2oo3).
c) More on Image Processing.
Several links on image processing tutorials, etc.
- ImageProcessingPlace.com Offers links on sites where you may find tutorials on image processing, theory and tutorials on common techniques used in image processing (wavelets, fuzzy image processing, etc), tutorials on software used for image processing (e.g., Matlab), and even basic introductions to fundamental knowledge such as calculus, linear algebra, etc.
- Computer Vision online, University of Edinburgh. Much more on the theory of image processing, not specifically focused on Remote Sensing.
- Remote sensing for ecosystem assessment, Utah State University. Remote sensing, image processing, applications.
No comments:
Post a Comment